Cumulative Stress Index

Common uses
- Quantifying the impact of stress on yields
- Prioritizing actions to improve orchard health
- Optimizing irrigation strategy
- Understanding year-over-year performance at the acre level

How it works
Growers know that the long-term profitability of an orchard depends on identifying and intervening in areas that experience persistent stress. But most methods of gauging stress—whether with pressure bombs, tissue sampling, or visual inspection—have a serious limitation: it’s impractical to test enough trees to gain an accurate assessment of the entire orchard.
Ceres Imaging makes this holistic view possible by combining the perspective of aerial data with the power of machine learning. The Cumulative Stress Index quantifies likely impacts on yield, enabling growers to determine whether interventions will deliver positive ROI.
Use the Cumulative Stress Index mid-season to assess yield trends, or at the end of the season to refine irrigation strategies, map yields, and run cost-benefit analyses.
From imagery to action
A four-year study with the University of California found that a 20% cumulative stress score corresponded with an 11% reduction in yields each year on average.


Quantify the impacts of persistent stress
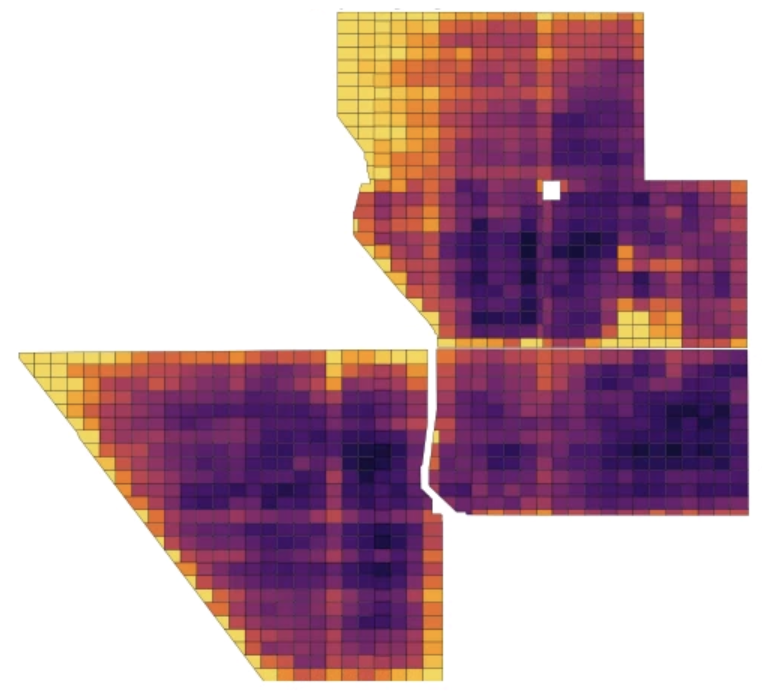
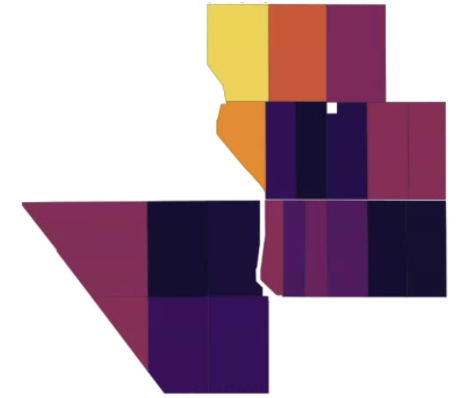
Dark purple represents the least stressed areas, while yellow areas are the most stressed. Each successive color on the scale corresponds to a 7%–8% increase in cumulative stress.
The Cumulative Stress Index can be delivered mapped to an acre-grid or to customized irrigation zones.
Ensuring accuracy
Ceres Imaging’s emphasis on quality begins even before we fly your fields.
Image capture
We capture imagery during peak daylight hours and under weather conditions that minimize distortion from shadows and cloud cover. Our highly sensitive, custom-built cameras detect minute changes in the multispectral range—allowing us to detect crop stress earlier than our competitors.
Processing and analysis
Imagery is geo-referenced and meticulously “masked” to ensure that only relevant information is evaluated. By making use of crop-specific data models and isolating the canopy from ground cover and other background noise, we prevent skewing of the data and enable a more accurate assessment of plant health.
Quality control
Imagery is assessed in-house by Ceres Imaging’s remote sensing experts, passing through multiple checkpoints before delivery in the Ceres Imaging app within 48 hours of the flight. Growers can access their data on a mobile device, tablet, or desktop computer.
More imagery and analytics
The difference between Ceres AI and other technologies I've used is the help I get from their expert team.
With Ceres AI we can take a more targeted approach to applying fertilizer and nutrients.
These flights can cover way more ground and provide more insight than a dozen soil moisture probes — and it's cheaper to implement.
The average Ceres AI conductance measurement from its imagery over the season has provided the best correlation with applied water.

