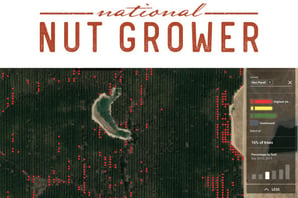
For large operations, maximizing farm profits demands the right combination of big-picture thinking and incredible attention to detail. Ceres Imaging customers have the advantage of analytics tools up to the task: for the first time, growers can use aerial data for an at-a-glance, quantitative assessment of crop health at the individual plant level.
Ceres Imaging's John Bourne discusses these new developments in National Nut Grower.

In a basic sense, the system identifies and creates a model on each individual plant, which is then followed by a very high resolution separation of other signals. When the software then creates the index of the plant a grower is monitoring, like a chlorophyll or water stress index, the information is being constructed on a per plant level.
“Then growers are able to look and compare trends and assess information on a per crop basis,” said Bourne. “Growers can say they only want to look at their most highly stressed plants, and they can toggle off anything other than that, giving them the visual and quantitative overview of their highest stressed crops.”
If growers want to see changes or trends that occurred week over week, or where crops went from no stress to high stress, they can, allowing them to quantify and make management decisions based on the number of plants, as opposed to seeing general areas that are or are not stressed. For some crops with varieties, the plants can be sorted to look at stress by variety, which growers can use to dive beyond visuals and more deeply into the tracking of that data.
To learn more and read the full article, visit National Nut Grower.
