As orchard and vineyard managers begin to look ahead to the 2020 season, Ceres Imaging is rolling out new tools and features to help.
Ceres Imaging app users can expect usability improvements, including offline access to imagery—making it easier to put data to work into the field even without cell service. We'll also be providing more detailed flight information, from scheduling flights to delivered imagery.
A selection of new analytics tools is designed to help growers get the most out of their imagery. If you're managing perennials, here's what you can expect.
Year-over-year change analysis
New for the 2020 season, Ceres Imaging can provide year-over-year change analyses to help growers identify weak areas in tree nut or stone fruit orchards. By tracking and segmenting developments in overall canopy area and quality—along with other indicators of plant health— year-over-year analysis equips orchard managers to make precise and informed decisions on nutrition, irrigation, pruning, and replant needs.
Year-over-year change analysis joins the Varietal Tree Count Tool among Ceres Imaging's products purpose-built for specialty crops.
Chlorophyll Index improvements
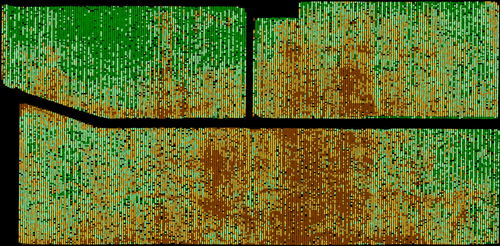
More sensitive to nutrient differences than NDVI imagery, Ceres Imaging's Chlorophyll Index has long provided growers with actionable insights on plant health. Over the past year, we've worked closely with research partners to improve our analyses even further. Refined segmentation techniques mean that the Chlorophyll Index will now reflect only the chlorophyll content of the crop canopy—not soil or understory growth such as grass or weeds. The result? Ever-more accurate measurements to inform scouting, nutrient deficiency assessments, and management zones for variable rate applications.

Beginning in the 2020 season, this imagery will be included as a standard feature for all customers managing perennial crops—delivered at critical times throughout the season.
Cumulative Stress Index
Another new standard feature for Full Season and Enterprise Management tree nut customers is the Cumulative Stress Index. For growers looking to make corrective actions to optimize yields, the index helps pinpoint areas of yield variability—allowing for better-informed and more strategic decision-making.
The index works by mapping the difference in applied water as a percentage of evapotranspiration between blocks of a particular crop type, maturity, and varietal.

For more information on these tools—or help planning your 2020 season, with Ceres Imaging—don't hesitate to get in touch. Contact your customer representative or support@ceresimaging.net.